Lioness Publications LLC

Predictive ProbabilitiesResearch 

Risk/Yield Chart


Reading the charts is relatively simple - the vertical axis is Risk/Yield while the horizontal axis is time. Data sampling is done twice a month and the results graphed out.  Activity falling above the 0 horizontal point is termed "RISK" while activity moving up and above the 0 indicates YIELD. It's not unusual to have activity in both sections and it is also not unusual to have wave patterns where activity moves from one area to another and then back.  If there is more in the RISK area, the path is not so easy and may not be successful as many barriers may stand in the way but, it does not mean impossible.  If there is more in the YIELD area, then the path is easier with less barriers but, it does not mean automatic success as there may be a tendency to be over-confident and that can lead to failure.

Each area is subdivided into Core and Transient - Core is defined as longer term trends while Transient (as the name implies) are more fleeting and indicates daily/weekly changes. 

An example in a Celebrity Person's Risk/Yield chart would be a rumor - you would expect the impact would be an immediate spike for the transient as it hits the news but, it also impacts the core as the rumor is filtered out and examined over the following months.  

An example in a corporate chart would be an earnings release - there would be a spike in the transient data when earnings are released and there would likely be a corresponding shift in the stock price but being a transient, this settles down within days/weeks.  If the earnings are either significantly better or worse than expected, the core data would also be impacted and be shown in the data over a period of months as the information is shifted through and the stock is either bought or sold.     


Donald Trump's Risk/Yield Chart
This is an example of Donald Trump's Risk/Yield chart for 2016.  There is activity in both sides of the chart and could be describes as a wave pattern specifically at the period when the election takes place.  The RISK portion of his chart is becoming more pronounced as the activity in the YIELD decreases.  This may be an indication that his chances of succeeding in the election is less probable.    

7/13/2016 update - The period around the convention is marked by increases in both the Yield and Risk and indicates a period of instability - so while expectations are Trump comes out of convention with a bump in polls, his negatives will also increase.  The movement into Yield is likely corresponding with the Vice President pick. 
Trump's Delta Risk/Yield for 2016
11/3/2016 update - everything is going according to the graphs, seeing an uptick in movement towards the Yield area however, it peaks right around 12/1 and then drops sharply -- this is suggestive of someone that surges at the polls and then fights over the results.  See the reference at 7/28 update to this being tied up in courts ...
9/26/2016 update - A bit of an uptick from the 9/15 to 10/1 period but just barely.  Expect that the debate might give a little push especially with the media attention but, with voters not likely anything that will last beyond a few days.  Expect anger and a push to be forceful and to dominate the stage - after all, he is the showman and he just loves the attention. 
8/11/2016 update -  Small bump in Trump's polls spiking around the middle of August and then a downward dip until about mid-September.  After that expect more of the same until right before election.    
7/28/2016 update - this chart is the delta of the Risk/Yield and details more easily the movement down into Risk or the movement up into Yield.  The darker line is core trends (long term) while the green line is the Transient trends (short term).  In this case, the core moves deeply into Risk during July and slowly starts moving up into Yield (barely into Yield) by the middle of August.  The Core stays right around the "0" level right into November.  One important note is that the line goes up in November but, drops sharply in December - could be that the election will be tied up in the courts (again) and not decided until middle of December or so.    
Hillary Clinton's Risk/Yield Chart
Hillary Clinton's chart indicates that there is less in her way and that her path may be easier than thought.  Although, sometimes having it easy means that the dangers are ignored until too late.  With a chart that looks like this, first opinion is that Clinton can walk away with the Presidency since she has a preponderance of YIELD in her chart at the time of the election.

7/13/2016 update- It is noticeable that her Core Risk factors increase at the beginning of July corresponding to the release of the FBI investigation.  While there is a dip into Risk - it is short-lived and has dissipated by mid-September.  It is worthwhile to mention that the convention period is occurring during the increase in Core Risk factors - result is she may not have much of a bounce from her convention or Vice President selection.  
Clinton 2016 Delta Risk/Yield
11/3/2016 update - still going according to the graphs, Hillary is stable and is expected to pull through her voters even if they wish they had a better choice however, expect contested results.
9/26/2016 update - expect that with the high standards expected from Hillary, the debate is not going to be a win for her - the best is a draw. But more important, while the media spin might attempt to damage her performance, the voters are with her.
8/11/2016 update - expect more bad news from released emails and Donald Trump's barrage at least until mid-August and resulting effect on polls will be negative but, then the polls should start heading up again and plateau around mid-September. 
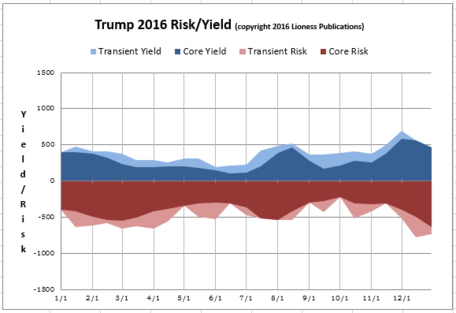
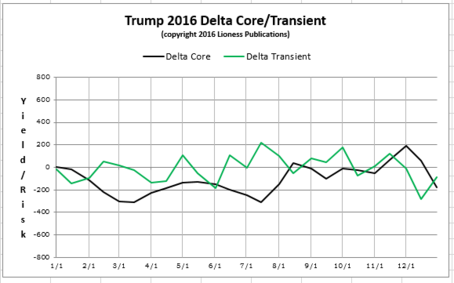
7/28/2016 update - Clinton's Risk/Yield chart is significantly different than Trump's in that it is obvious that the delta core trend line (black line) stays high in Yield most of the year (positive for probability).  There is a dip that starts rom the beginning of July and returns back to original placement the middle of September.  This dip is likely from the release of the DNC emails and as can be seen the low point is at middle of August so probability that damage will continue until then even though the release of emails may be finished or soon to be finished. After mid-September, the delta core goes right back up and stays there though the election in November 2016. As noted in Trump's description - it is highly probable that the result will be litigated by Trump.  The green line is the Delta Transient trends (short term) and can pick up the consensus opinion of her by the public and this is showing that even though her delta core trend is into Yield, her delta transient trend barely has peaks going into Yield.  She also does not have a significant jump at election time and this is significant in that if she had a higher value, it would make her probable win a higher percentage but, in this case, chances are people will vote for her but, hate (really hate) doing it.