Lioness Publications LLC

Predictive Probabilities Astrology Research 

Seizure Study - Case 1

Note, the charts overlap on dates.


1/1/2011 - 5/3/2011


  •  yellow arrow indicates first seizure
  • slight vertical trending before 2/24/2011
  • significant vertical trending starting 2/25/2011 and continuing to 1st seizure

4/1/2011 - 8/1/2011


  • no seizure activity noted in this period 

          7/1/2011 - 10/31/2011

          • this period had 3 seizures noted by the yellow vertical lines
          • each seizure is corresponding to a slight movement of the trend above the baseline threshold

          10/1/2011 -  1/31/2012

          • 2 seizures are noted during this period
          • Seizure in October is after a significant uptrend had occurred and the 2nd seizure had the same configuration. Note, seizures occurred approx. 1 week after uptrend completed.
          • Significant peak at January timeframe and might be considered a false positive

          1/1/2012 - 5/2/2012


          • The peak in January discussed in previous period
          • 1 seizure occurred in this period approx. 1 week prior to a significant uptrend

          4/1/2012 - 8/1/2012


          • 1 seizure occurred in this period after a slightly elevated trend approx. 2 weeks prior

          7/1/2012 - 10/31/2012


          • 5 seizures occurred over a period of 3 days (clusters)
          • preceded by significant uptrend 3 weeks prior and 1 week prior
          • seizure occurred in October without a move above the baseline either prior or after and thus, false negative

          10/1/2012 - 1/31/2012


          • 5 seizures occurred during this period with a set of 3 being a cluster in January
          • 1st and 2nd seizures are pre and post a slight upward trend
          • 3rd, 4th, and 5th seizures are at between points where the trend slightly moved above threshold

          1/1/2013 - 5/2/2013


          • This period had 6 seizures and these 3 sets of 2 seizures
          • Seizures occurred at periods of significant vertical movement of trend


          4/1/2013 - 8/1/2013


          • Seizure in April discussed in previous period
          • cluster of three in May occurred at a significant vertical movement of trend
          • next 4 seizures occurred in the period of slight upward trend
          • Seizure on 7/21/2013 is approx. 1 week from significant vertical trend at 8/1/2013
          • Seizure on 8/1/2013 occurred with significant upward trend

          7/1/2013 - 10/31/2013


          • Seizures prior to 8/1/2013 discussed in previous period
          • 8/4/2013 seizure at significant upward trend

          10/1/2013 - 1/31/2014


          • no seizures

          1/1/2014 - 5/3/2014


          • 2 seizures at a slight upward trend

          4/1/2014 - 8/1/2014


          These charts are being initially being provided on 3/24/2014 and as such, seizure activity has not been recorded for this period at this time.

          Future Charts

          7/1/2014 - 10/31/2014


          Indications that the period from 8/20/2014 thru to 10/11/2014 could have heightened seizure activity.   

          10/1/2014 - 1/31/2015


          The period centered at the 12/6/2014 timeframe might have potential for increased seizure activity although the duration is not long it is preceded by a period starting 12/22/2014 to 11/30/2014 of higher than usual activity. 


          Another period starting 1/23/2015 has a slight longer duration and has a high level and thus, indicates another period of possible seizure activity.

          1/1/2015 - 5/1/2014


          The period at 3/2/2015 to 3/8/2015 might have sufficient potential to coincide with a seizure.  There is a lengthy period starting from 2/18/2015 that has the potential to build up to a seizure around the 3/6/2015 period.


          There are two smaller periods at the 3/24/2015 and tat 4/3/2015 while crossing the threshold, are not as likely as other periods to coincide with a seizure.


          The period at 4/21/2015 to 5/1/2015 has a sufficient amount of activity that it could correspond with a seizure.

          4/1/2015 - 8/1/2015


          This period has one significant area that starts 4/18/2015 and concludes at about 6/2/2015 and has sufficient movement over the threshold for a long enough duration to coincide with a seizure(s).


          While the 2nd period from 6/24/2015 to 6/30/2015 does move over the threshold, the duration of the movement over the threshold is relatively short and not as likely to coincide with a seizure.


          The period from 7/2/2015 to 8/1/2015 is relatively low and therefore, seizure potential is low. 

          7/1/2015 - 10/31/2015


          The early part of the chart has low activity and corresponds with a low seizure expectation.


          The period starting at 9/1/2015 to 10/25/2015 has a series of movements up to the threshold and over the threshold.  This indicates a higher than normal potential for seizure activity.  

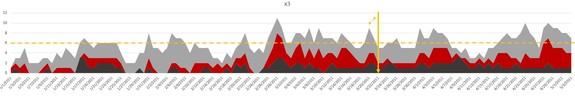
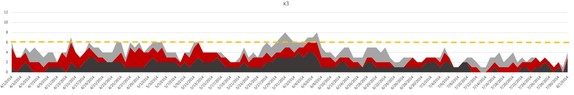
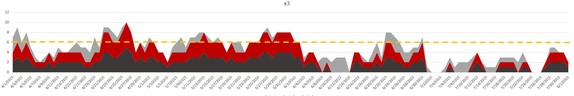
          10/1/2015 - 1/31/2015


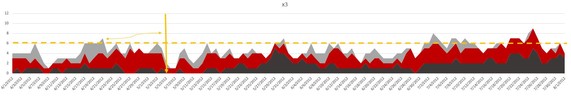
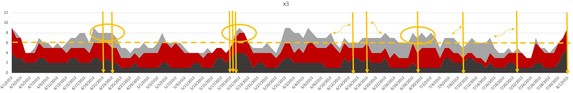
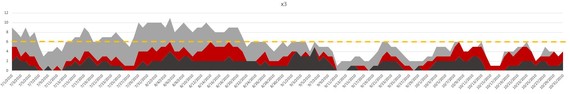
          The first period was discussed in the previous section.


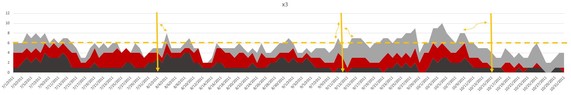
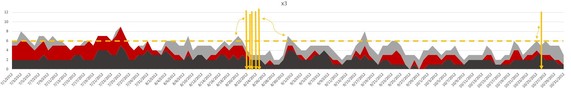
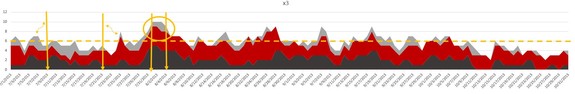
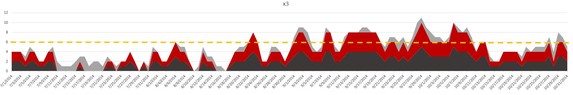
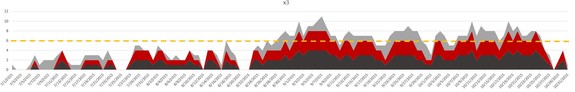
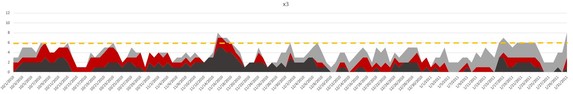
          The next movement over the threshold occurs at approximately 12/2/2015 but is a relatively short duration with very little movement pre and post the move over the threshold.  It is a movement over the threshold so, it may coincide with seizure activity but likely, less potential than other movements that have a longer duration.


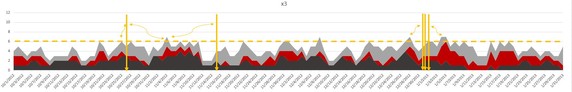
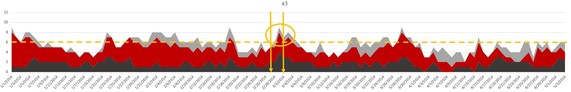
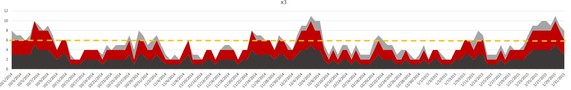
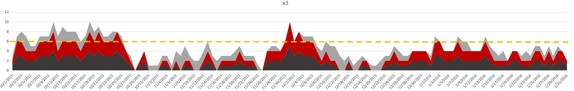
          The last movement up to and slightly over the threshold occurs from 1/3/2015 to 1/11/2016 and has less potential for a seizure as the movement over the threshold is limited but, the potential exists as the duration is relatively long.


          Baseline Charts before initial seizure

          These following charts can provide examples of data points before seizures activity was noted.


          1/1/2010 - 5/3/2010


          • no seizure activity
          • a few slight upward trends

          4/1/2010 - 8/1/2010


          • no noted seizure activity
          • few slight upward trends
          • note, upward trends are mostly derived from the grey area

          7/1/2010 - 10/31/2010


          • no noted seizures
          • one period of significant vertical trend


          10/1/2010 - 1/31/2010


          • no seizures noted
          • one period of significant upward vertical trend in November